- 您现在的位置:买卖IC网 > Sheet目录365 > TC4425VMF (Microchip Technology)IC MOSFET DVR 3A DUAL HS 8DFN
TC4423/TC4424/TC4425
2.0
Note:
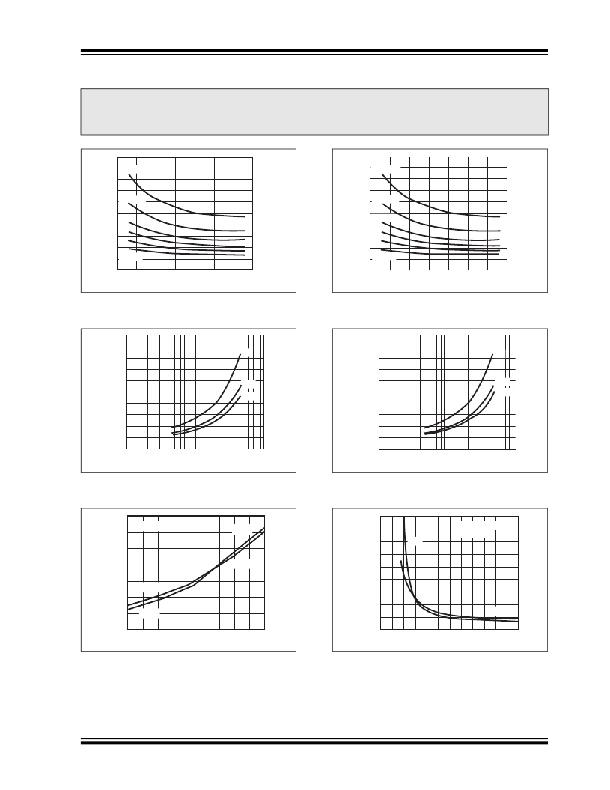
TYPICAL PERFORMANCE CURVES
The graphs and tables provided following this note are a statistical summary based on a limited number of
samples and are provided for informational purposes only. The performance characteristics listed herein
are not tested or guaranteed. In some graphs or tables, the data presented may be outside the specified
operating range (e.g., outside specified power supply range) and therefore outside the warranted range.
100
80
4700 pF
100
80
4700 pF
60
40
3300 pF
2200 pF
60
40
3300 pF
2200 pF
20
470 pF
1500 pF
1000 pF
20
470 pF
1500 pF
1000 pF
0
0
4
6
8
10 12
14
16
18
4
6
8
10 12
14
16
18
V DD (V)
V DD (V)
FIGURE 2-1:
Voltage.
100
80
60
Rise Time vs. Supply
5V
10V
FIGURE 2-4:
Voltage.
100
80
60
Fall Time vs. Supply
5V
10V
40
20
0
15V
40
20
0
15V
100
1000
10,000
100
1000
10,000
C LOAD (pF)
C LOAD (pF)
FIGURE 2-2:
Load.
32
Rise Time vs. Capacitive
FIGURE 2-5:
Load.
100
Fall Time vs. Capacitive
30
C LOAD = 2200 pF
t FALL
80
t D1
C LOAD = 2200 pF
V DD = 10V
28
26
24
22
t RISE
t RISE
60
40
20
t FALL
20
t D2
18
-55
-35
-15
5
25 45
65
85
105 125
0
1
2
3
4
5 6 7
8
9
10 11 12
T A ( ° C)
Input (V)
FIGURE 2-3:
Rise and Fall Times vs.
FIGURE 2-6:
Propagation Delay vs. Input
Temperature.
? 2004 Microchip Technology Inc.
Amplitude.
DS21421D-page 5
发布紧急采购,3分钟左右您将得到回复。
相关PDF资料
TC4427MJA
IC MOSFET DVR 1.5A DUAL HS 8CDIP
TC4428VUA713
IC MOSFET DVR 1.5A DUAL HS 8MSOP
TC4429VPA
IC MOSFET DRIVER 6A HS 8DIP
TC4432VOA713
IC MOSFET DRIVER 30V 1.5A 8SOIC
TC4452VPA
IC MOSFET DVR 12A HS 8DIP
TC4467COE
IC MOSFET DVR QUAD NAND 16SOIC
TC4627EOE
IC MOSFET DRIVER 1.5A 16SOIC
TCN1.25SV
THERMASHIELD CONVOLUTED 1.25" 4'
相关代理商/技术参数
TC4425VMF713
功能描述:功率驱动器IC 3A Dual RoHS:否 制造商:Micrel 产品:MOSFET Gate Drivers 类型:Low Cost High or Low Side MOSFET Driver 上升时间: 下降时间: 电源电压-最大:30 V 电源电压-最小:2.75 V 电源电流: 最大功率耗散: 最大工作温度:+ 85 C 安装风格:SMD/SMT 封装 / 箱体:SOIC-8 封装:Tube
TC4425VOE
功能描述:功率驱动器IC 3A Dual RoHS:否 制造商:Micrel 产品:MOSFET Gate Drivers 类型:Low Cost High or Low Side MOSFET Driver 上升时间: 下降时间: 电源电压-最大:30 V 电源电压-最小:2.75 V 电源电流: 最大功率耗散: 最大工作温度:+ 85 C 安装风格:SMD/SMT 封装 / 箱体:SOIC-8 封装:Tube
TC4425VOE713
功能描述:功率驱动器IC 3A Dual RoHS:否 制造商:Micrel 产品:MOSFET Gate Drivers 类型:Low Cost High or Low Side MOSFET Driver 上升时间: 下降时间: 电源电压-最大:30 V 电源电压-最小:2.75 V 电源电流: 最大功率耗散: 最大工作温度:+ 85 C 安装风格:SMD/SMT 封装 / 箱体:SOIC-8 封装:Tube
TC4425VPA
功能描述:功率驱动器IC 3A Dual RoHS:否 制造商:Micrel 产品:MOSFET Gate Drivers 类型:Low Cost High or Low Side MOSFET Driver 上升时间: 下降时间: 电源电压-最大:30 V 电源电压-最小:2.75 V 电源电流: 最大功率耗散: 最大工作温度:+ 85 C 安装风格:SMD/SMT 封装 / 箱体:SOIC-8 封装:Tube
TC4426
制造商:TELCOM 制造商全称:TelCom Semiconductor, Inc 功能描述:1.5A DUAL HIGH-SPEED, POWER MOSFET DRIVERS
TC4426_06
制造商:MICROCHIP 制造商全称:Microchip Technology 功能描述:1.5A Dual High-Speed Power MOSFET Drivers
TC4426_13
制造商:MICROCHIP 制造商全称:Microchip Technology 功能描述:1.5A Dual High-Speed Power MOSFET Drivers
TC4426A
制造商:MICROCHIP 制造商全称:Microchip Technology 功能描述:1.5A Dual High-Speed Power MOSFET Drivers
